How to verify air pollution models?
Interview, 24 March 2021
Last December Vladislav Svozilik from the Technical University of Ostrava (VŠB-TUO), who has been working at JINR for a long time, defended his Ph.D. thesis on the topic “Verification of Mathematical Air Pollution Modelling Results”. His scientific supervisor was Petr Jančík (VŠB-TUO), who conducts studies on air pollution monitoring and modelling in Dubna. Jan Makhonin talked with the scientists about the progress in this area and its prospects.
JM: What exactly is the verification of mathematical air pollution modelling results?
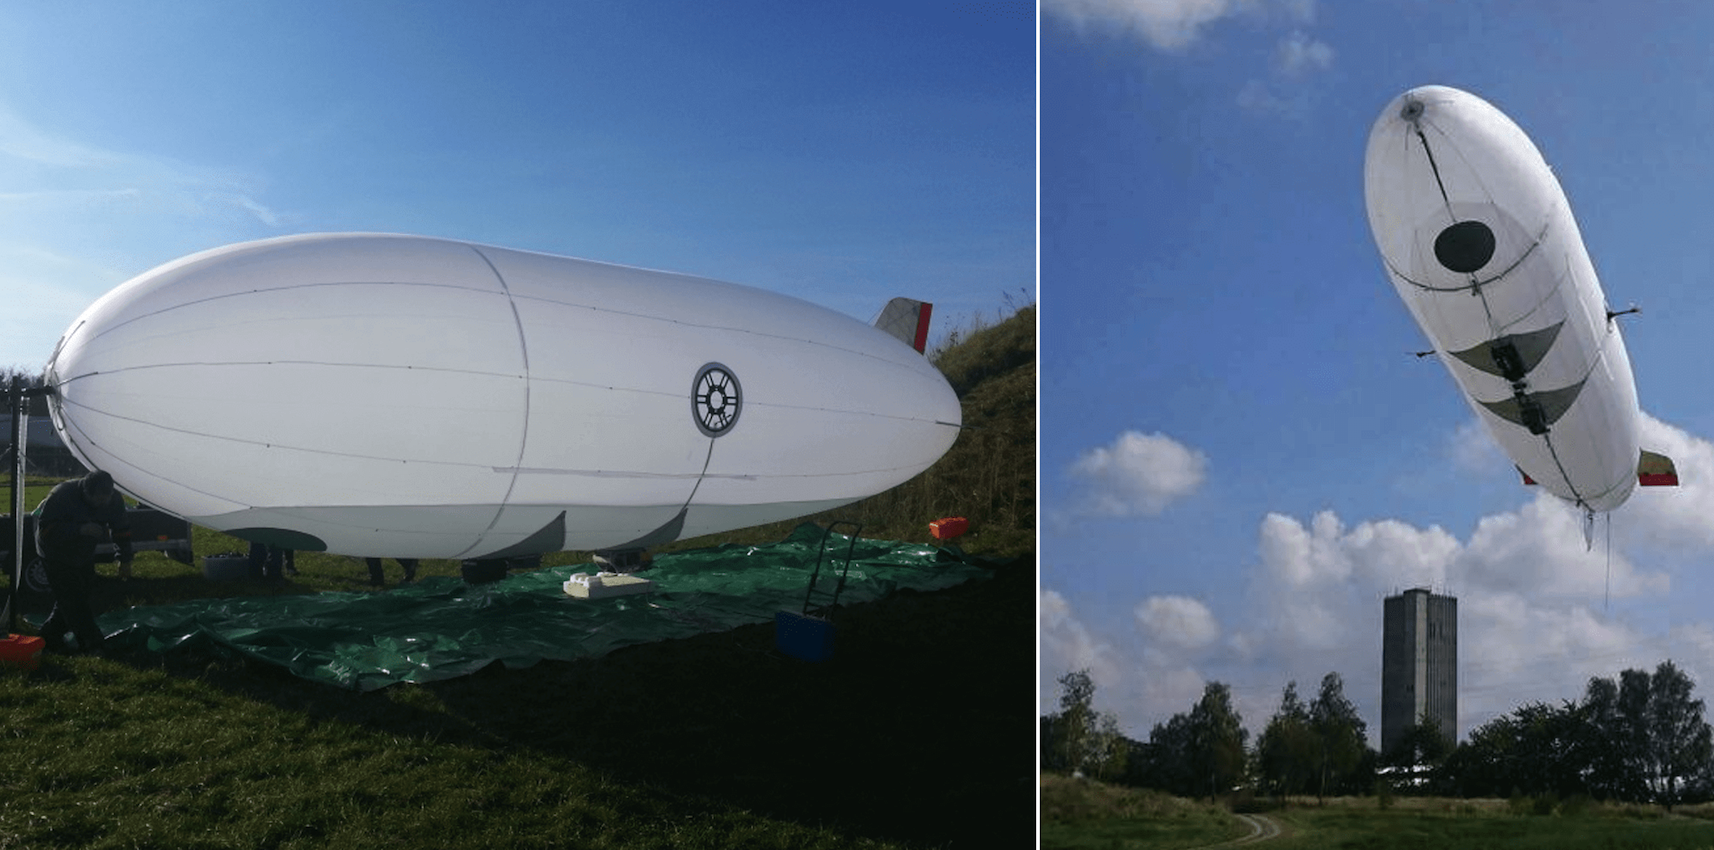
PJ: We have been modelling the spread of pollutants in the atmosphere, i.e. the relationship between pollution sources and the state of atmospheric air in a certain region, for a long time. As more efficient computing equipment and algorithms for its optimal use emerge, we expand our models to cover areas equal to the Czech Republic. After calibrating the modelling results to the results of the air pollution monitoring system, the models become reasonably accurate. However, we wanted to verify them in some other way and decided to focus on specialized monitoring technologies. To do this, we utilized an unmanned airship , which enables the continuous measurement of the level of air pollution. Another technology we used was moss biomonitoring.
VS: To be more precise, my PhD thesis is devoted to the verification of the Analytical Dispersion Modelling Supercomputer System (ADMoSS) for air pollution modelling. The model, originally developed for a personal computer, was applied to computing clusters (supercomputers) and significantly automated. We are constantly improving and optimizing the system as a whole. At present, we can model large areas in detail, and the limiting factor in this case is the availability of high-quality data. The core of the ADMoSS is the SYMOS’97 Gaussian model developed by the Czech Hydrometeorological Institute. We never have complete information about all emissions from different sources in the modelled area, and therefore, the SYMOS’97 model gives, as a rule, underestimated values. In this regard, the modelling results are to be calibrated using the monitoring of pollutant concentrations. The problem with this approach lies in the fact that emission monitoring data represent an integral part of mathematical modelling and cannot simply be taken and applied to verify the results of the modelling itself. Thus, I set myself the objective of exploring the possibilities of verifying the ADMoSS results using alternative monitoring methods. In my work, I focused on the Czech-Polish-Slovak borderland, however, the developed methods can be used almost anywhere in the world.
JM: What alternative monitoring technologies did you utilize to validate the ADMoSS system?
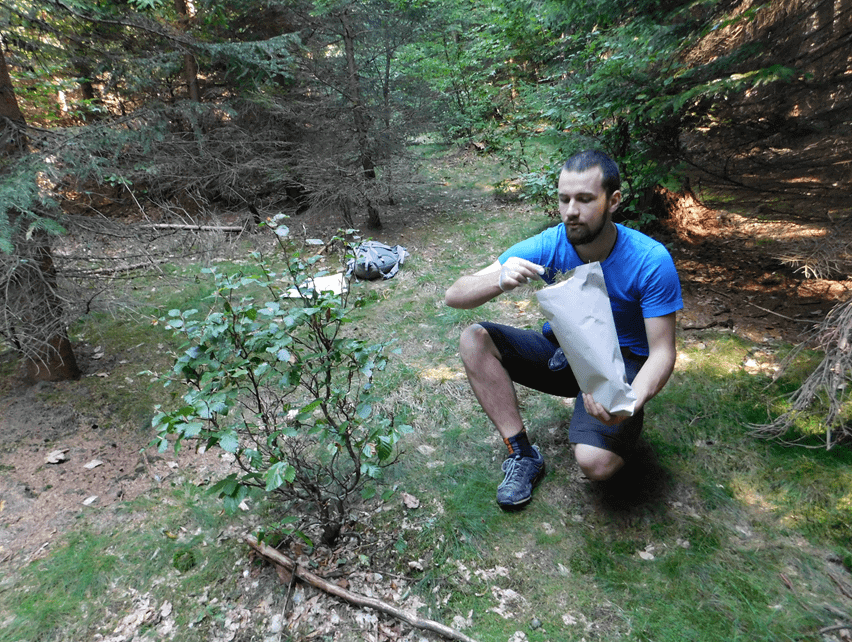
VS: The verification was performed using the results of two special monitoring methods. The first one is a method for measuring air pollution by unmanned airships, and the second one is biomonitoring of the state of the atmosphere using mosses. The first approach turned out to be ineffective, since the modelling results comprise a long-term situation in a large area, while aerial measurements of air pollution do not enable this. The given method is more suitable for analyzing the vertical composition of pollution and measuring dynamic phenomena, such as, for example, the spread of individual smoke plumes under specific meteorological conditions, the resuspension of dust by convective flows and other phenomena that are difficult to analyze using mathematical modelling. In contrast, moss biomonitoring reflects the long-term situation in the study area. Owing to biomonitoring, increased concentrations of elements were detected in some places. They are related to metallurgical production, mining, solid fuel combustion and correlate well with the mathematical modelling results.
PJ: First of all, we wanted to verify how those models corresponded to the indicators obtained by measurements in a vertical slice, i.e. using the above-mentioned airship and additional biomonitoring. We were interested not so much in some absolute values of long-term pollution, as it is impossible to measure them using such methods, but in the composition of air pollution, namely, where the atmosphere is more polluted, where is less and what reason is for this. Are the data consistent with what the model shows? As a result, it was confirmed that the analysis and shares of individual groups of sources were, in essence, correct.
JM: Could you elaborate on moss biomonitoring? What role did JINR play in your studies?
PJ: Sampling, or moss collection, was carried out in collaboration with our Dubna colleagues from JINR participating in the ICP Vegetation project, which we also joined. This is a UN project aimed at studying air pollution by heavy metals in Europe and further to the east. Associate Professor Marina Frontasyeva, who worked as Head of the Sector of Neutron Activation Analysis and Applied Research of the Frank Laboratory of Neutron Physics (FLNP) for a long time, is actively involved in the project. This method lies in collecting mosses of a specific type in a clearly defined way (so that the results obtained in different parts of the world can be compared). Then, using neutron activation analysis, it is defined which elements are contained in the given moss samples. As a rule, this method is used for huge territories at the level of states and continents. We conducted detailed research on a regional scale, with the goal of identifying specific pollution sources. We succeeded in it to a certain extent.
More information about JINR’s participation in the ICP Vegetation project
VS: Air pollution is a complex phenomenon. I would like to emphasize that several leading research centres from the Czech Republic, Poland, Slovakia and Russia were involved in the studies. Within JINR I collaborated with colleagues from the Sector of Neutron Activation Analysis and Applied Research of the Frank Laboratory of Neutron Physics and with a group of scientists from the Laboratory of Information Technologies, who are responsible for the operation of the supercomputer, which we use in modelling. My work is multidisciplinary: it presupposes that I know well the entire process; therefore, I was involved in all activities, including field and laboratory work. However, the key part of my work was to process special data obtained as a result of neutron activation analysis. On the basis of these data, we managed to get information on the concentration of individual elements in mosses in the study area. Further, a comparison with the results of mathematical modelling was made using spatial analysis and statistical methods.
PJ: One should understand that there were about a hundred of sites in the region where mosses, which may contain about forty elements, were studied using neutron activation analysis. This is how a “data cloud” was formed. It encompasses the results of the analysis of hundreds of samples with combinations of elements, characterized by both the presence of some elements and their absence, or their different concentrations in moss samples. We needed to perform the statistical and spatial processing of these data. As a result, clusters were identified in certain areas, on the basis of which it became clear that those combinations of elements were apparently related to producers of some pollutants, i.e. industrial complexes, local fuel-burning facilities or transport. The data that we obtained in this way were also used in such international projects as “AIR BORDER”, “AIR TRITIA” and “AIR PROGRES CZECHO-SLOVAKIA”.
JM: How could such modelling be applied in the future?
PJ: At present, the models allow anyone to see the causes and potential prospects of pollution in the Tritia region (the border region between the Czech Republic, Poland and Slovakia). On their basis, we created the Air Quality Management System (https://aqms.vsb.cz) within the international project “Interreg Central Europe AIR TRITIA”.
In the future, we would like to see how COVID-19 cases (disease course and mortality) were distributed across the territory and how this could be associated with air pollution. As a rule, in all our projects we collaborated with hygienists and epidemiologists, who assessed the incidence rate and course of respiratory diseases in relation to air pollution. This dependence has always been observed. We have repeatedly tested our results on the most common respiratory disease, i.e. influenza, which also causes a severe course of disease and death. However, we faced the fact that the data on the incidence and severity of the disease course were not always available in a sufficiently detailed form. We now have a multitude of detailed data on a pandemic of this type of disease. There is a hypothesis that a more severe disease course is correlated with air pollution. Nevertheless, it is noteworthy that due to the pandemic, the share of the influence of the economy and transport on air pollution has also decreased, and we are to verify it on data. The geoinformation technologies and models we use are perfectly suitable for such tasks. If we combine these models with the models of the distribution of severe COVID-19 cases and filter out other factors, for example, the specific dynamics of the spread of the disease in a certain area, we will get the dependence of a more severe disease course on air pollution. It will be interesting to work on this from the viewpoint of mathematics and computer science.
VS: If we solve the air pollution problem, we will no longer face its negative consequences. Thus, I would focus on enhancing monitoring and modelling. Standard modelling in a huge number of applications represents an excessively data-intensive process that requires a lot of computing power. We strive to develop methods that allow obtaining the same results using sensor networks, advanced data analysis methods and neural networks. However, I do not want to write off standard modelling. Modern powerful supercomputers, such as the “Govorun” supercomputer (LIT JINR), are capable of performing much more accurate and detailed calculations than it was possible before. And in this direction, our expectations are related to the use of more computationally complex and more accurate processes.
JM: How can such studies influence our behavior in the future?
PJ: In the Tritia region that we are studying, air pollution results in an increase of 2,000 deaths per year. Last year about ten thousand more people died in this region due to the coronavirus. While this number is very high, the order of the numbers is not so different from the deaths due to air pollution each year for decades. And people are aware of it, but at the same time, they do not fight air pollution as selflessly as they have fought and continue to fight the COVID-19 virus. The established relationship between these data can play an important role in understanding the danger that air pollution can cause to us. All models that we create within the AIR TRITIA project are aimed at the future. Thus, using the models we can predict what impact a hypothetical decrease or increase in emissions from pollution sources will have on human health. We can verify these calculations with the help of the methods developed by Vladislav in his thesis. The measures that we propose are planned by us until 2040, and we can observe how it corresponds to what is happening in reality.
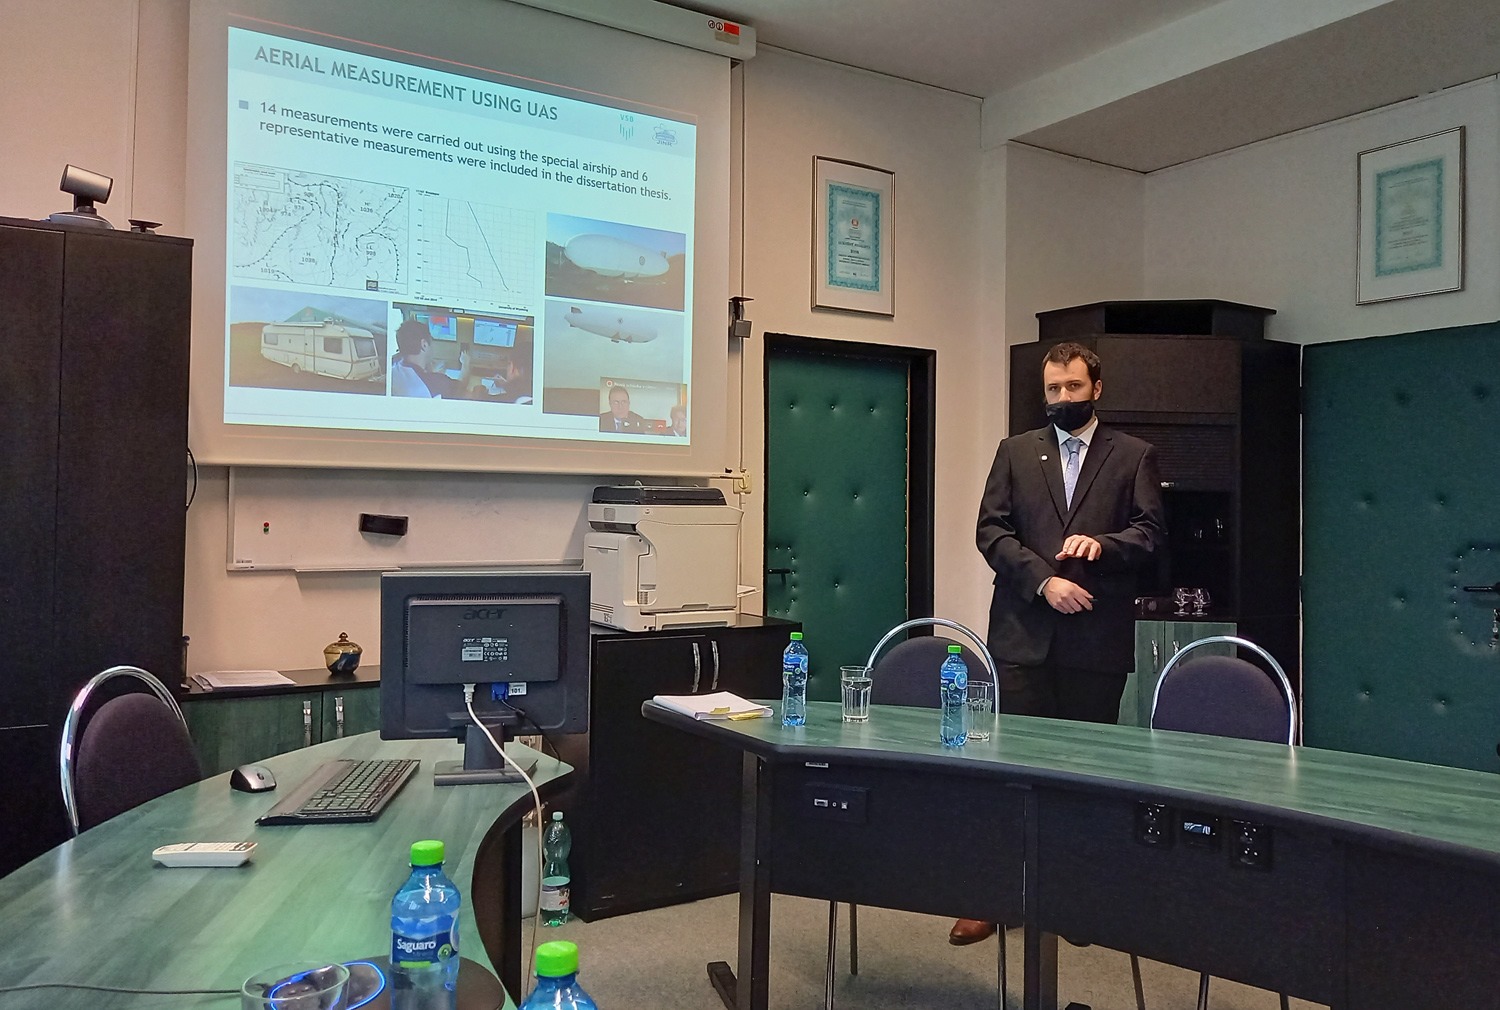
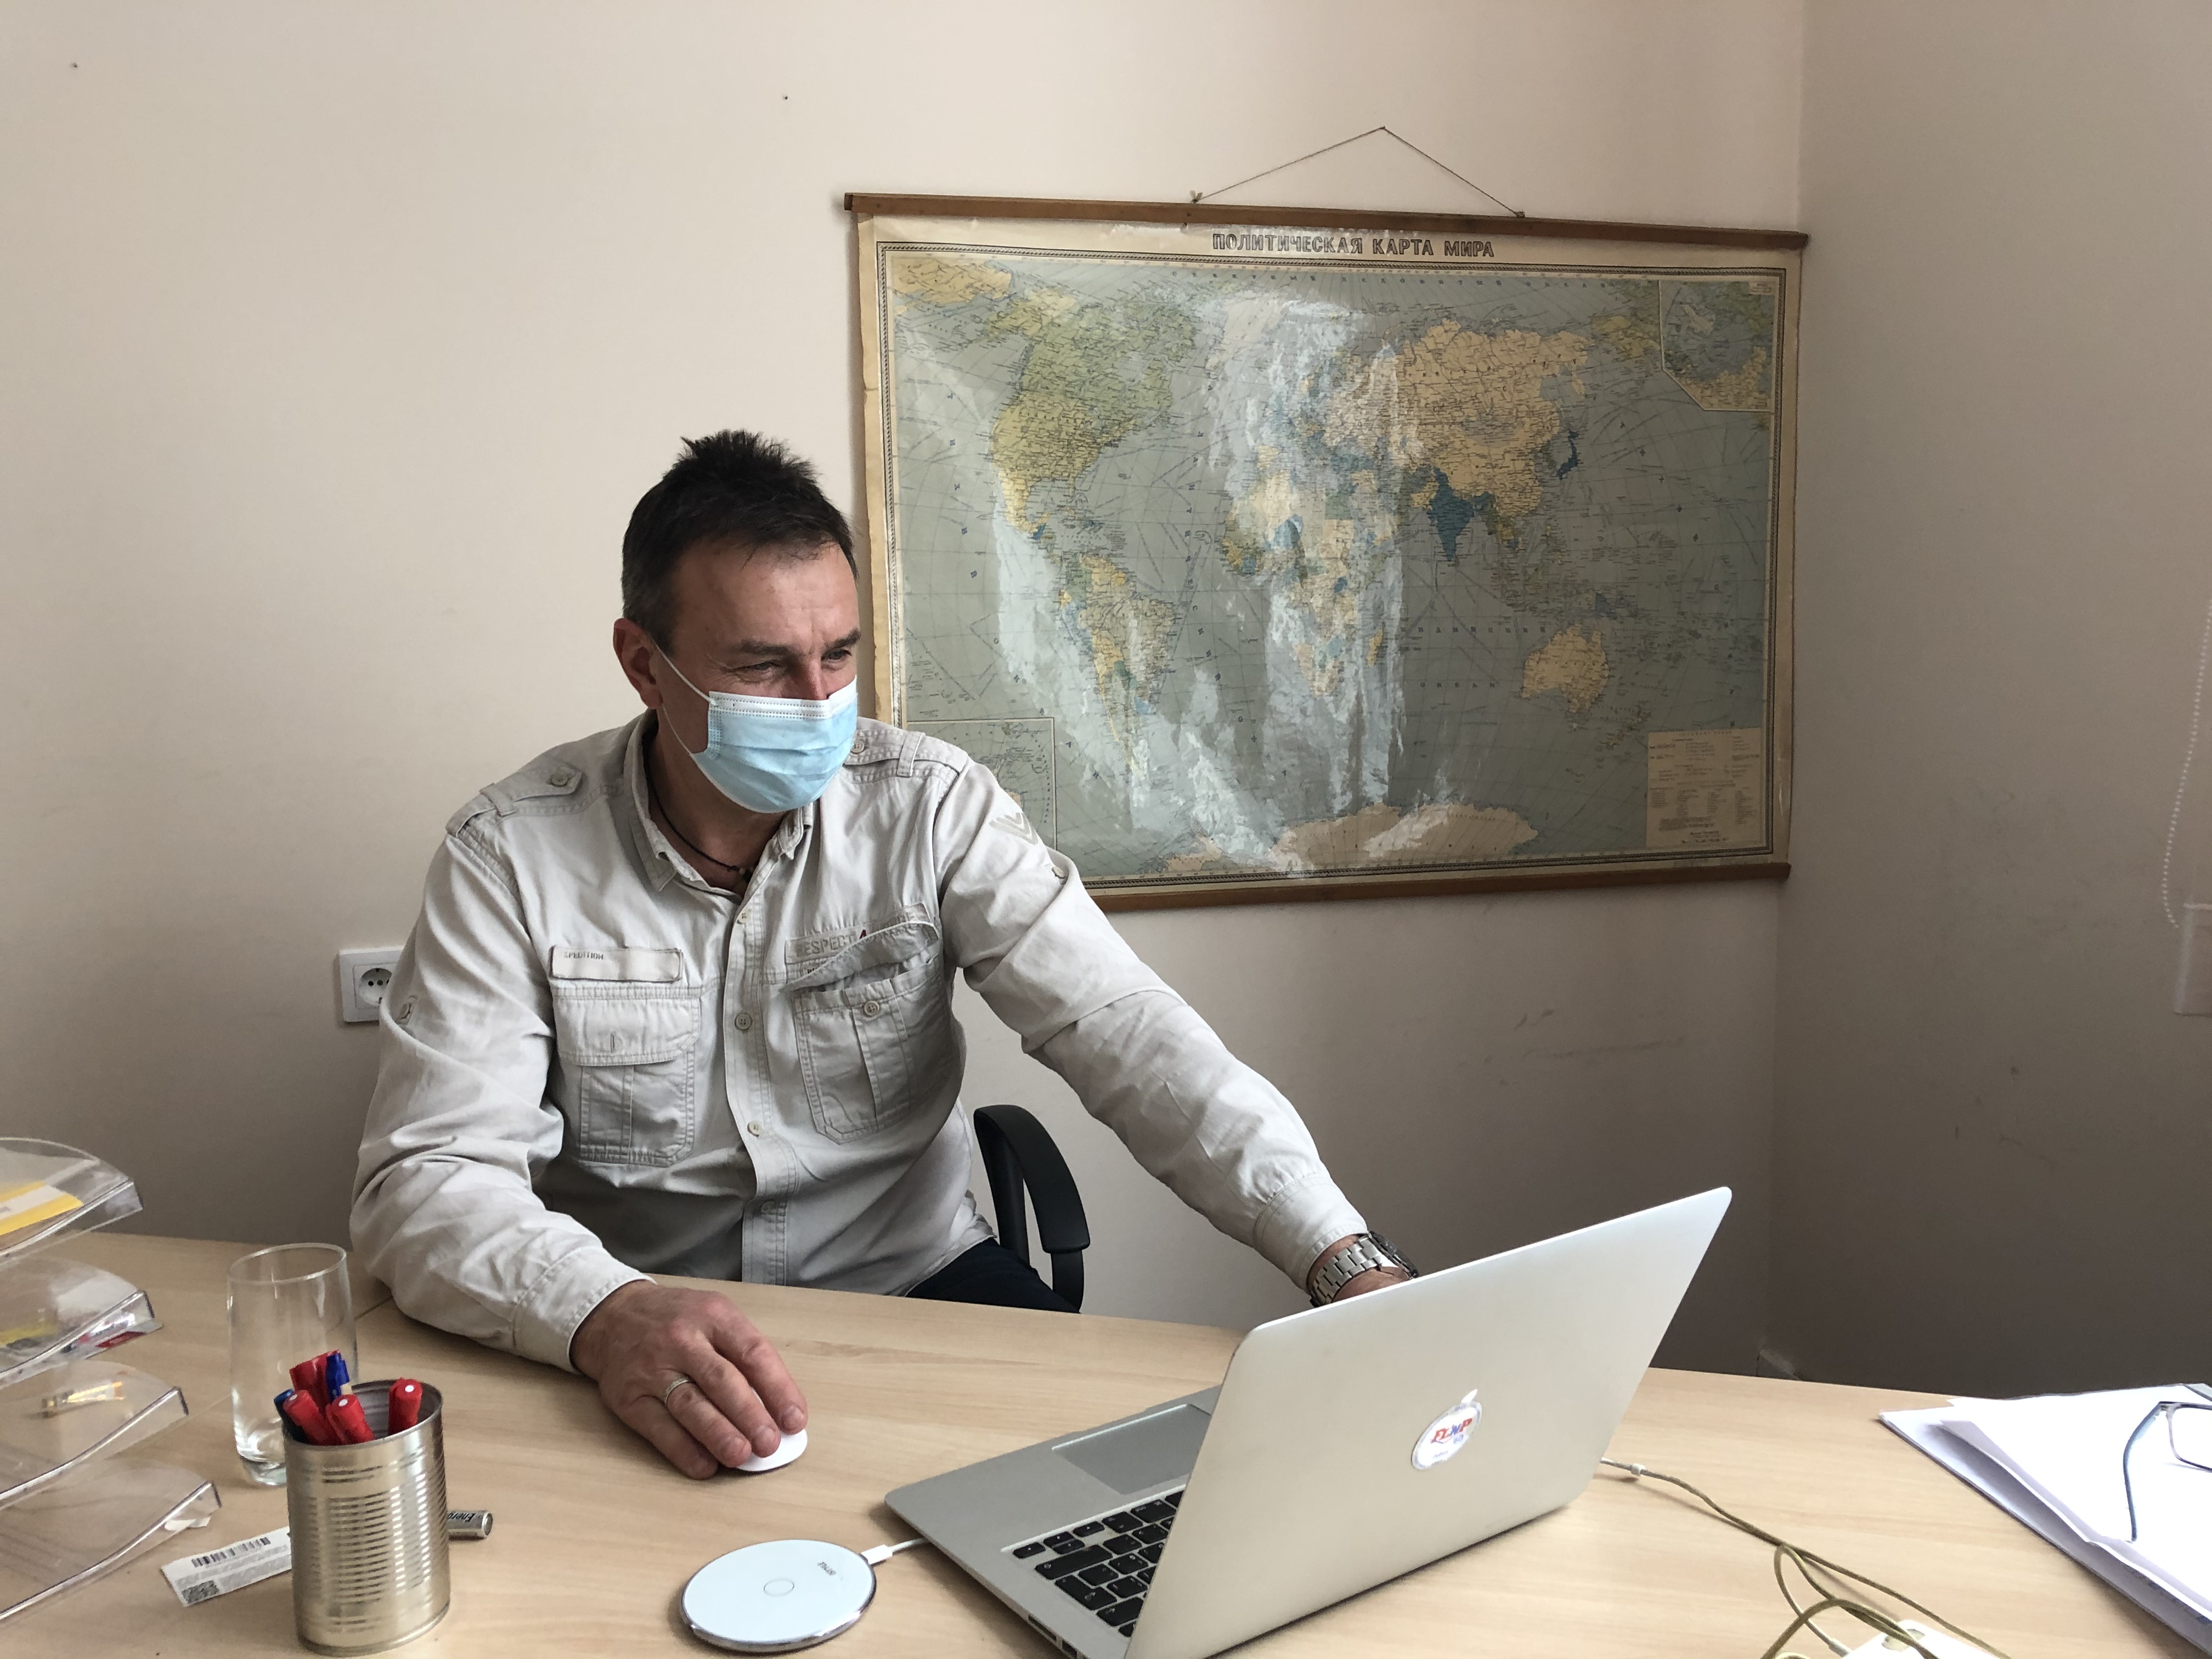
JM: The thesis defense was held remotely. What are your impressions?
VS: The defense took place at the Technical University of Ostrava. Three foreign opponents, who could not come due to the difficult epidemiological situation, and four members of the commission participated in the defense via the Ostrava-Dubna-Krakow teleconference.
PJ: For me, the online thesis defense was quite an interesting experience. Some people, including Vladislav Svozilik, were present in the room of the Technical University of Ostrava, while the opponents and the other members of the commission took part remotely, being in Russia or Poland. And it worked! The atmosphere was pleasant.
Jan Makhonin
Photo courtesy of V. Svozilik