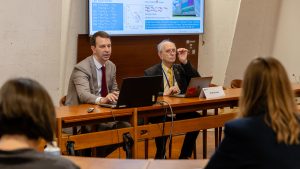
In a science project, it is important not only to get data, but also to be able to process it. The team of the Laboratory of Information Technologies JINR has developed a data management system for the UN environmental project UNECE ICP Vegetation coordinated by the Laboratory of Neutron Physics JINR. The system was created to simplify typical data operations, but over time it has grown into a complete environmental monitoring platform. Alexander Uzhinsky, a leading programmer of the Laboratory, speaks about the LIT JINR system for the UN programme.
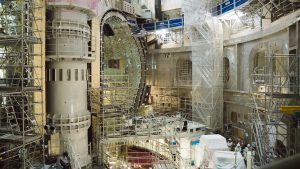
The problems of environmental pollution and environmental safety are always relevant. Special attention is paid to air pollution control. Most of the programs in this area focus on identifying particulate matter and some chemical compounds such as carbon dioxide. To obtain detailed information on the composition of contamination, monitoring methods based on sampling are used. In the 1980s, the UNECE ICP Vegetation program was created within the UN Convention on Long-Range Transboundary Air Pollution (CLRTAP). Its participants collect moss samples and use different analytical methods, including neutron activation analysis at the IBR-2 reactor of FLNP JINR, to determine the concentrations of heavy metals, nitrogen, persistent organic pollutants and radionuclides in the air. The project brings together researchers from 43 countries and regions of Europe and Asia. Since 2014, the Frank Laboratory of Neutron Physics has been coordinating the program (coordinator M. Frontasyeva). Despite the undoubted importance of the UNECE ICP Vegetation project, its level of automation and adoption of modern information technologies was quite low, which seriously limited the efficiency of data acquisition and statistical processing. In 2016, the Meshcheryakov Laboratory of Information Technologies started developing a data management system of the UNECE ICP Vegetation project. It was initially planned that the system would simplify and partially automate typical operations with data, as well as enable the fast creation of pollution maps. Over time, the system has evolved, incorporating more and more novel technologies and approaches, and now it can be considered an intelligent environmental monitoring platform [1].
Studies within the UNECE ICP Vegetation program are based on the analysis of mosses as biomonitors. Participants collect samples every five years, recording various information about sampling sites. Errors, which negatively affect the results, are possible in the process of recording and transferring metainformation. To reduce them, a mobile application was developed. It allows one to fill in most of the required parameters manually, while some data, such as latitude, longitude and altitude, are set automatically. Using the mobile application, one can take pictures of sampling sites and samples and send them to the platform for recognition. This made it possible to significantly simplify the process of defining the moss type, which is crucial for collecting metainformation and in some cases creates difficulties even for experts. On the basis of the platform, several deep learning models were tested to solve recognition tasks on a limited training dataset. The current implementation uses the model of a Siamese neural network with a triplet loss function. The Siamese network comprises several twin networks joined by the similarity layer (Fig. 1А).
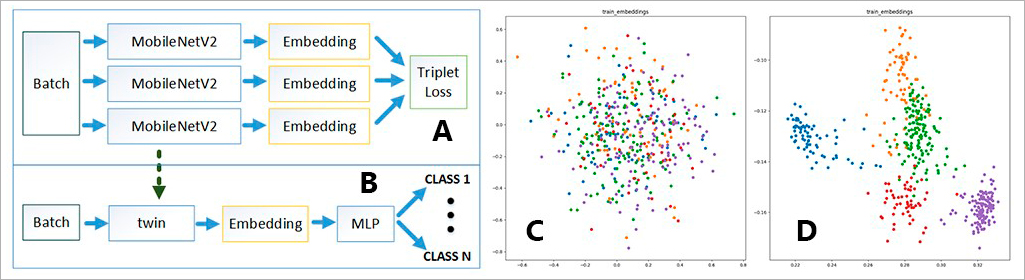 Figure 1. А – architecture of the Siamese network. В – one of the twins and MLP classifier. С and D – 2D image vector representation before training (С) and after training (D)
The weights of the twins are the same, so the result is invariant and ensures that similar images cannot be in different locations of the multidimensional feature space. When using the triplet loss function, the input consists of three images, two of which belong to the same class, and the third one belongs to another class. After evaluation, the weights are chosen so that the vector representations of similar images are closer to each other, and images of another class are farther from them (Fig. 1C, D). After training, one of the twins is used in conjunction with a multilayer perceptron as a classifier (Fig. 1B). Such a network architecture enables the classification of the five most common moss species with an accuracy of about 97.6% [2].
In the process of setting metainformation, each sampling site has a unique ID, which is used to import data on the concentrations of elements and compounds after analyzing the samples. The platform allows searching for statistical anomalies and checking the completeness and correctness of data. Full automation of the given process is impossible since anomalies can be of a natural kind and the agreed opinion of the participant and the coordinator is required for making a decision on their inclusion or exclusion. One of the uppermost tasks in the implementation of the platform was to minimize the need to use third-party systems. At present, project participants can manipulate data, create local and regional pollution maps, run prediction tasks and get analytical reports directly on the platform. In addition to simple statistics and geo-indexes, tools of a higher level, such as cluster analysis or principal component analysis, are available. Users can build historical trends and make comparisons with the data of other participants with the appropriate permission on their part. For example, to better understand the global situation, the median values of heavy metal pollution with bordering countries and regions can be shown in one diagram.
Coordinators have access to all tools of ordinary participants; in addition, they can perform group operations with data, receive summary reports and create global pollution maps.
Forecasting is an essential stage in environmental monitoring to fill data gaps. A forecasting mechanism based on machine learning and remote sensing data is implemented within the platform.
Images of various satellite programs are utilized to obtain so-called indexes, which act as additional data when training the model and as basic data when conducting the forecast. The Google Earth Engine platform, containing data from dozens of different programs and products, is used to calculate the indexes (Fig. 2).
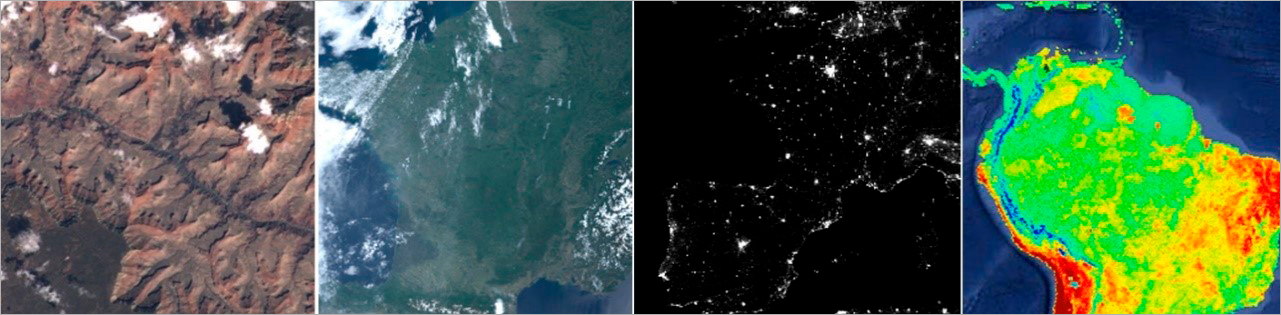 Figure 2. Examples of Google Earth Engine program images
Platform microservices are used to collect indexes, build global and local models, select optimal parameters and predict contamination. In the current implementation, statistical machine learning models or deep neural networks are used depending on the amount of training data. We are focused on regression and classification tasks, however, classification is prioritized since it becomes possible to apply balancing techniques for training datasets, and a gradation of pollution levels is initially used when building maps. For local and regional maps of some elements, the model accuracy reaches 90-95% (Fig. 3) [3].
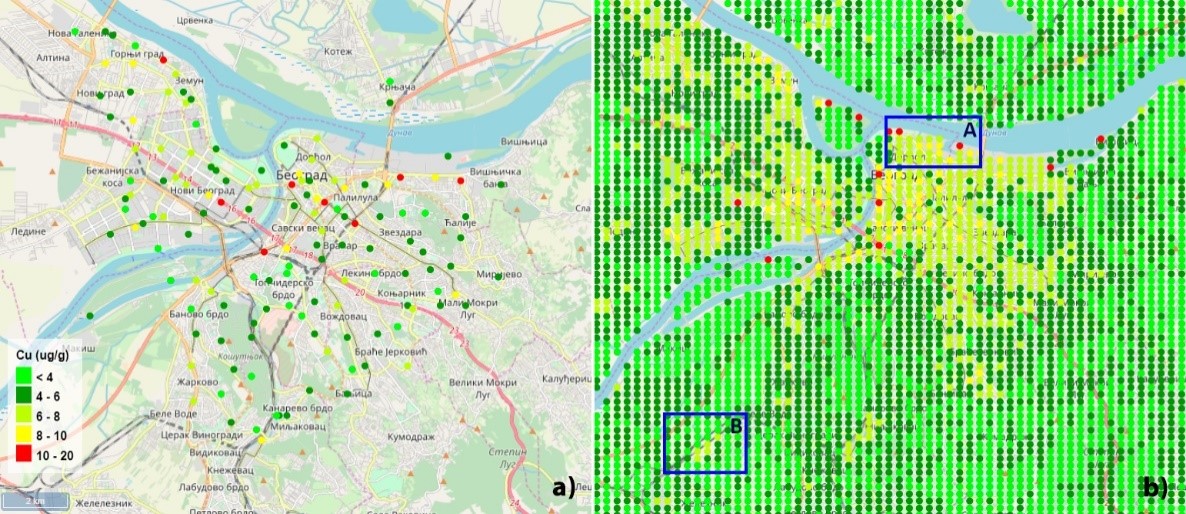 Figure 3. Examples of predicting the concentration of Cu in Belgrade: a) monitoring data, b) prediction values. Area A represents the central part of the city with high traffic. Area B represents a railway terminal
To develop the platform, it is planned to enhance the existing functionality, as well as to provide new opportunities. For example, the task of collecting and importing data on the morbidity of the population to the platform arouses great interest, which would enable the comparison of contamination levels and the number of certain diseases in different areas within the platform.
References:
[1] Uzhinskiy A. Intelligent environmental monitoring platform, Open Systems. DBMS. 2021. No. 2. Pp. 21-23. In Russian.
[2] Uzhinskiy A., Ososkov G., Goncharov P., Nechaevskiy A., Smetanin A., Oneshot learning with triplet loss for vegetation classification tasks. Computer Optics 2021; 45(4): 608-614. DOI: 10.18287/2412-6179-CO-856.
[3] A. Uzhinskiy, M. Aničić Urošević, M. Frontasyeva. Prediction of air pollution by potentially toxic elements over urban area by combining satellite imagery, Moss Biomonitoring Data and Machine Learning. Ciencia e Tecnica Vitivinicola Journal, ISSN:2416-3953, Vol. 35, No. 12, 2020.